Survey
Archaeologists working for the Ordnance Survey surveyed the enclosure in 1969 and drew a plan and a section. They would probably have used either a theodolite or a plane table. Their plan depicts the bank by using hachures. These are short dashes like tadpoles, arranged so that the head is at the top of the slope and the tail is at the bottom. The section shows a slice through the banks and the enclosure between. The outline of the plan has now been digitised and added to the OS MasterMap.
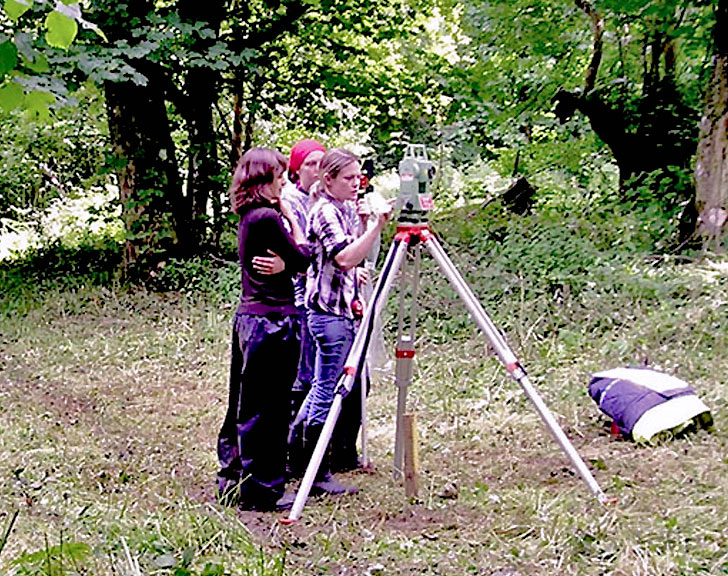
Modern methods of surveying make use of laser technology and can produce a very detailed plan much more easily. Readings are taken from a total station machine set up on just a few points — just one if the whole site is visible from it. Because there are a lot of trees at Church Hill, and still a lot of undergrowth even after the Forestry Commission had cut it back, we had to use three points. The total station sends laser signals to a portable target which is carried round the site on a staff. It measures the distance between it and the target, and the angle up or down, and logs the results electronically. These can then be downloaded into a computer. A suitable software package is used to present the results graphically.
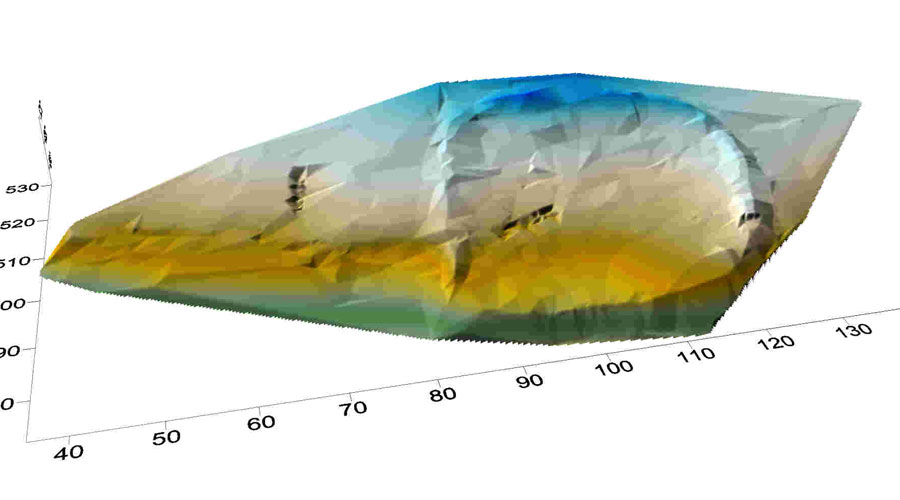
If you click on the pictures, you can see different ways of presenting the information. Rowena produced the coloured version on the last day of the fieldwork so that the students could see what they had been working on. Use of colours enables her to show two things. One is the natural shape of the ground. The site slopes down gently for about 4m from the blue at the top to the orange and yellow on the edge of the escarpment where dives off steeply into Green Cwm (green). The other thing what is on the surface of the ground. You can see the D-shaped bank surrounding the enclosure very clearly, and also where our trenches have been dug. It is also possible to make out very faintly where the track crosses the site.
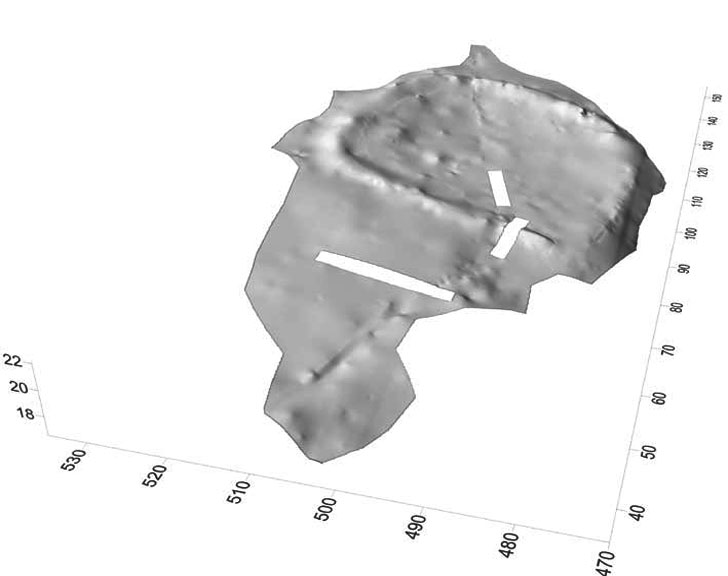
The black and white version was produced for the final report, as most archaeological journals still do not print in colour. Rowena is using a more detailed dataset to produce a much more refined representation of the earthworks. This does not make an enormous difference as to how the bank is shown, but it gives us a much better view of the track, and enables us to see the faint earthworks in the northern half of the enclosure more clearly, although we still can´t tell exactly what might be buried under them. She has shown the trenches on this version as blank rectangles, which makes it much easier to separate out how the site looked before we started, and what we did to it. However, we have much less information on the background slopes.
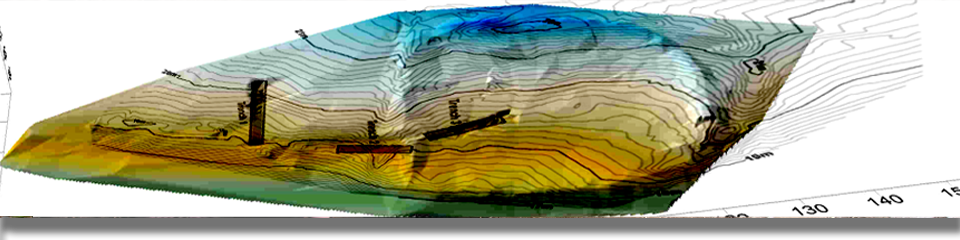
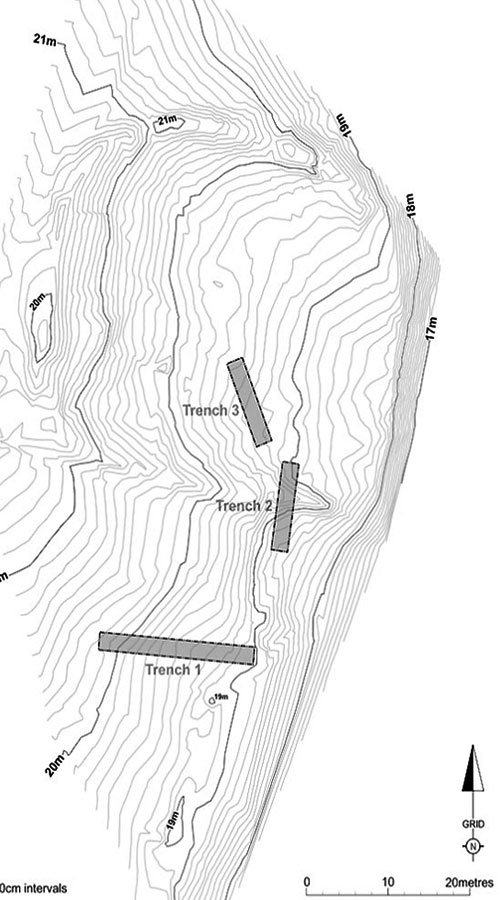
The third drawing shows the same information represented as contours taken at intervals of 0.1m. This gives a good view of the natural slope of the ground, but the bank just shows as a deformation in them, which is much more difficult to interpret.